
It's like pottery but with graphs! What I mean is we are creating pretty things out of stuff many consider junk.
By Stephanie Britt
Many people throughout the history of mathematics have study the form
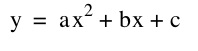
It seems to be important in math. So let's explore it. If we set a and to be 1 and vary b between positive and negative numbers we will see a slight change.
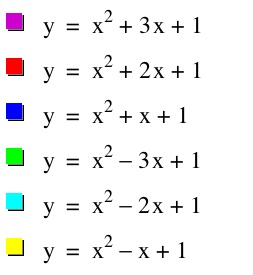
The graphs look like
We can see above that the y-intercet remains at 1 with each change of b and c at a constant of 1, but the vertex changes as b ranges from 3 to -3.
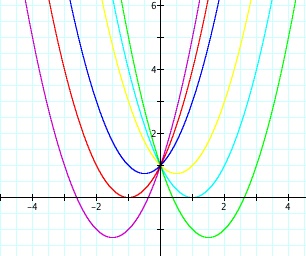
If we actually change b to n in the equation and vary c we can use the graphing calculator to animate the formula and see the changes visually where.
with n ranging from -5 to 5 we can see the graphs vertex changing as x decreases from 10 to -10 but the y-intercept remains the same at 1.
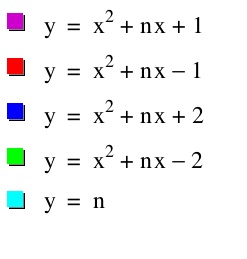
If we paused the animation and solved for the solutions to each equation we would see that the intersection between the line y=n and the quadratic is the solution or roots for each quadratic.
For y=n or y=3 and c=2
the graph is as follows
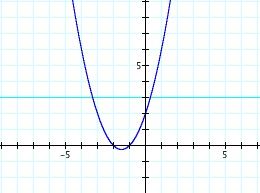
If we solve for x in the quadratic we can see that x=-2 and -1.